Met Office YCN Brief

For this project I set out to explore different modes of data visualisation and science communication in the context of weather data. The UK Met Office makes the majority of its data publicly available, including current weather observations, weather forecasts and historical records reaching back hundreds of years.
Initially I worked on a chatbot that could serve as an intuitive interface to the Met Office's datasets. A chatbot is a natural-language interface that exists within existing messaging applications such as Whatsapp, SMS or Facebook Messenger. I propose this as a more personal, lightweight alternative to traditional weather applications.
The robot is built on the Microsoft Bot Framework, which uses machine learning to understand natural language. Location-based inputs such as "How's the weather in Manchester" are parsed using the Google Maps API before the appropriate weather information is requested from the Met Office API. The resulting data is then converted back into natural language and presented to the user. The source code is available on Github.
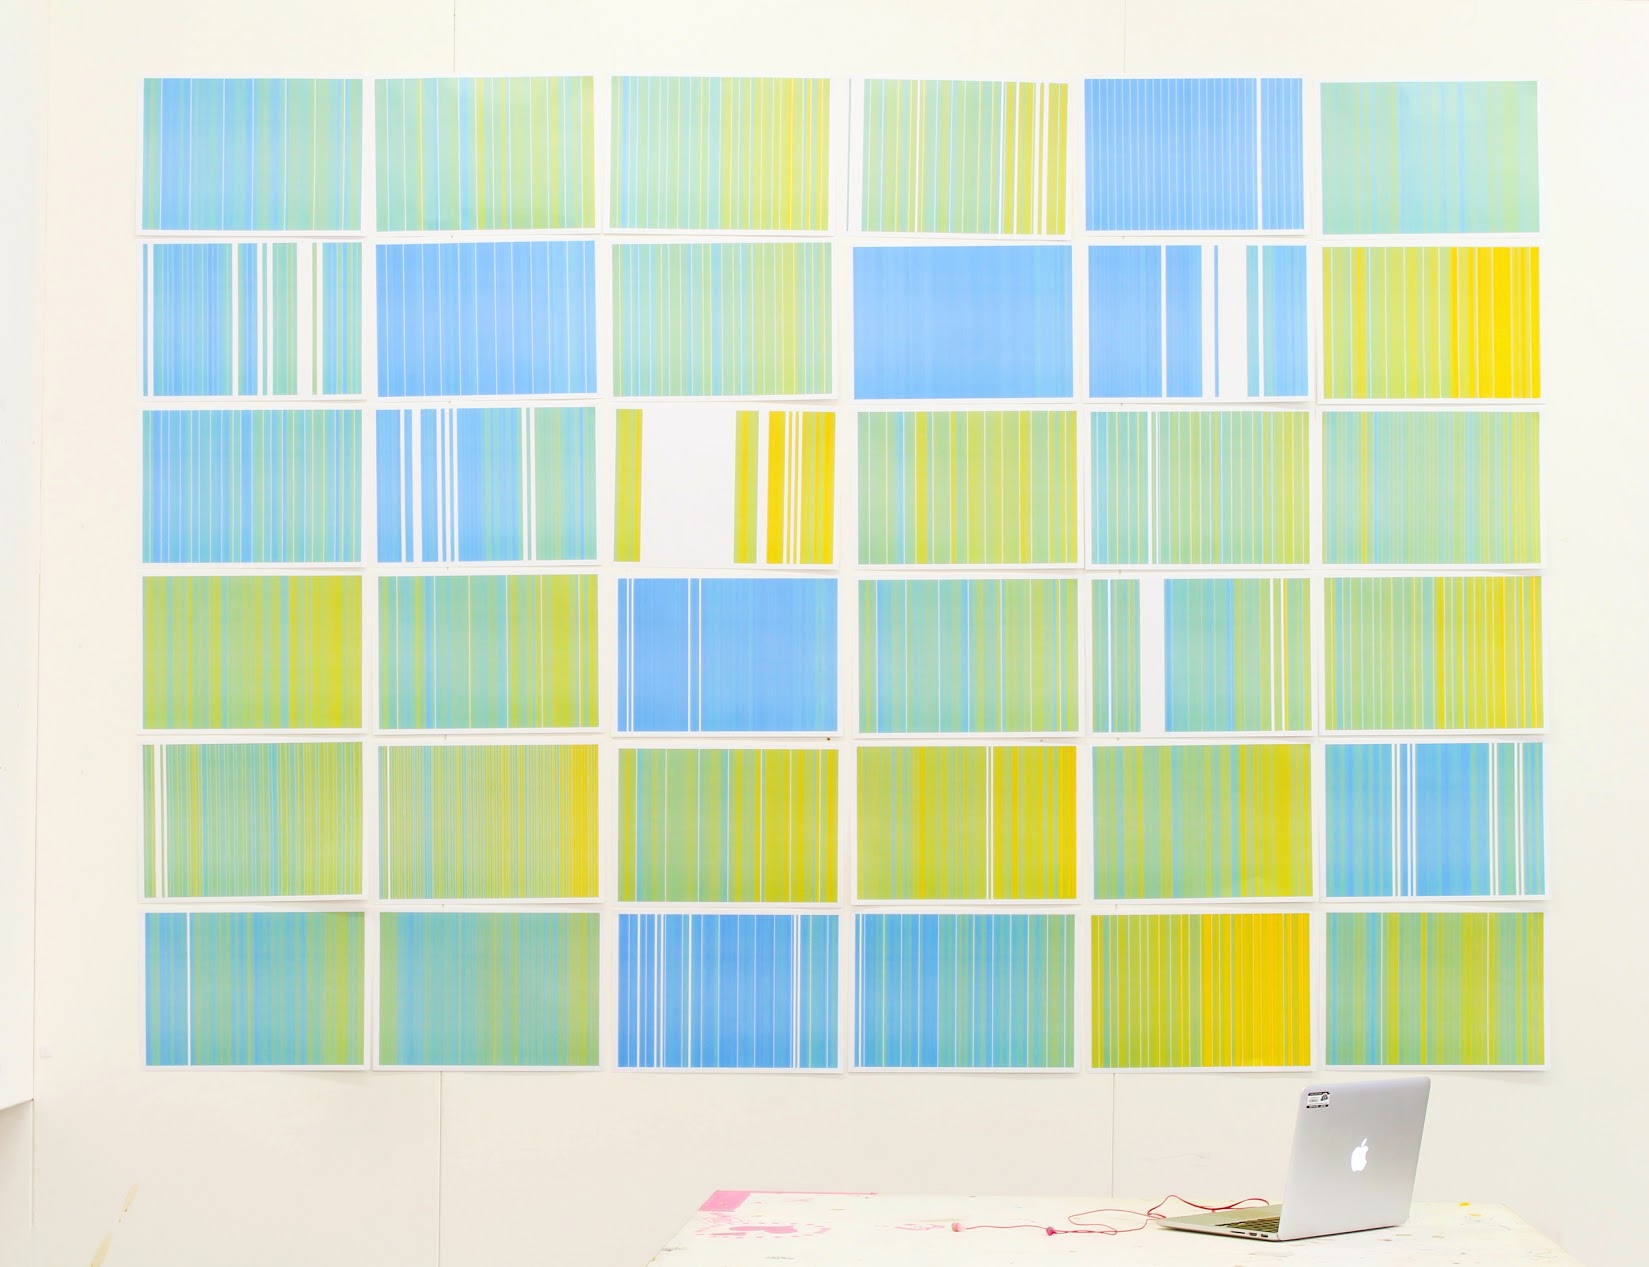
Next, I focused on a dataset containing historical weather observations going back as far as 1853. I made a series of attempts to visualise the roughly 50.000 data points it contains.
- Spreadsheet listing observation sites
- Spreadsheet showing the Central England Temperature Record
- Map showing site locations
- Significant Events
- Line Graph
- Animated bar chart showing monthly temperatures - Y axis showing temperature, X Axis showing 25 different observation sites, colour coding showing the amount of rain.
- Animated bar chart showing annual average temperatures - Y axis showing temperature, X Axis showing different observation sites.
Eventually I found a successful way to show average temperatures as colours on a spectrum. This was the first approach I discovered that made global warming easily visible.
All visualisations were built using d3.js. The source code is available on Github.
I have some thoughts on design competitions.